Category Archives: Climate Science

Urbanization bias III. Estimating the extent of bias in the Historical Climatology Network datasets

Ronan Connolly1*, Michael Connolly1
1 Dublin, Ireland.
* Corresponding author. E-mail:
xGHCN_urban_ratio

The extent to which two widely-used monthly temperature datasets are affected by urbanization bias was considered. These were the Global Historical Climatology Network (GHCN) and the United States Historical Climatology Network (USHCN). These datasets are currently the main data sources used to construct the various weather station-based global temperature trend estimates.

Although the global network nominally contains temperature records for a large number of rural stations, most of these records are quite short, or are missing large periods of data. Only eight of the records with data for at least 95 of the last 100 years are for completely rural stations.

In contrast, the U.S. network is a relatively rural dataset, and less than 10% of the stations are highly urbanized. However, urbanization bias is still a significant problem, which seems to have introduced an artificial warming trend into current estimates of U.S. temperature trends.

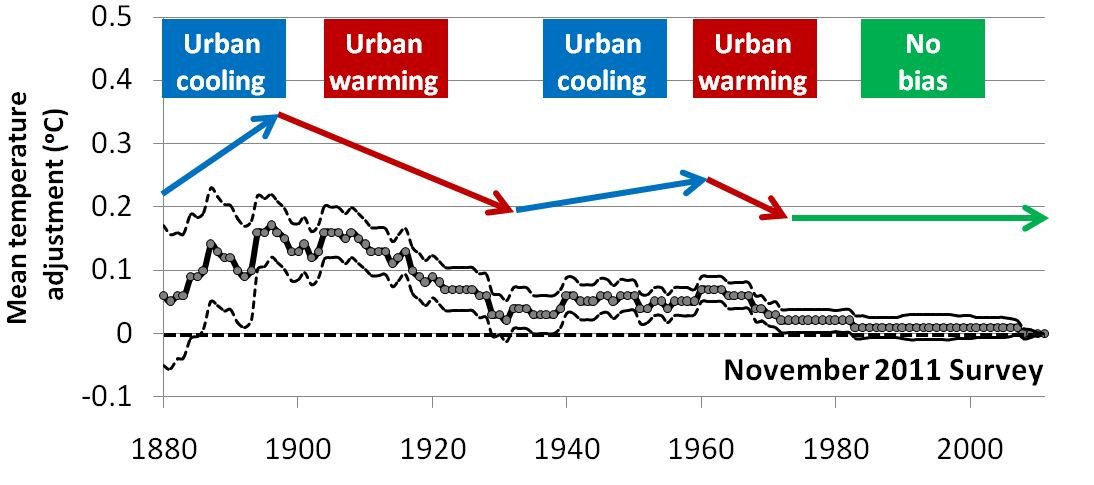
The homogenization adjustments developed by the National Climatic Data Center to reduce the extent of non-climatic biases in the networks were found to be inadequate, inappropriate and problematic for urbanization bias. As a result, the current estimates of the amount of “global warming” since the Industrial Revolution have probably been overestimated.

R. Connolly, and M. Connolly (2014). Urbanization bias III. Estimating the extent of bias in the Historical Climatology Network datasets, Open Peer Rev. J., 34 (Clim. Sci.), ver. 0.1 (non peer reviewed draft). URL: http://oprj.net/articles/climate-science/34
First submitted on: January 8, 2014. This version submitted on: January 8, 2014

Creative Commons Licence
This work is licensed under a Creative Commons Attribution-ShareAlike 4.0 International License.

pdficon_large Download article – Version 0.1

Supplementary Information is available through the FigShare website at http://dx.doi.org/10.6084/m9.figshare.1004125

Urbanization bias II. An assessment of the NASA GISS urbanization adjustment method

Ronan Connolly1*, Michael Connolly1
1 Dublin, Ireland.
* Corresponding author. E-mail:
net_adjustments

NASA GISS are currently the only group calculating global temperature estimates that explicitly adjust their weather station data for urbanization biases. In this study, their urbanization adjustment procedure was considered.

A number of serious problems were found with their urbanization adjustments: 1.) The vast majority of their adjustments involved correcting for “urban cooling”, whereas urbanization bias is predominantly a warming bias. 2.) The net effect of their adjustments on their global temperature estimates was unrealistically low, particularly for recent decades, when urbanization bias is expected to have increased. 3.) When a sample of highly urbanized stations was tested, the adjustments successfully removed warming bias for the 1895-1980 period, but left the 1980s-2000s period effectively unadjusted.

In an attempt to explain these unexpected problems, a critical assessment of their adjustment procedure was carried out. Several serious flaws in their procedure were identified, and recommendations to overcome these flaws were given.

Overall, NASA GISS’ urbanization adjustments were found to be seriously flawed, unreliable and inadequate. Until their adjustment approach is substantially improved, their global temperature estimates should be treated with considerable caution.

R. Connolly, and M. Connolly (2014). Urbanization bias II. An assessment of the NASA GISS urbanization adjustment method, Open Peer Rev. J., 31 (Clim. Sci.), ver. 0.1 (non peer reviewed draft). URL: http://oprj.net/articles/climate-science/31
First submitted on: January 8, 2014. This version submitted on: January 8, 2014

Creative Commons Licence
This work is licensed under a Creative Commons Attribution-ShareAlike 4.0 International License.

pdficon_large Download article – Version 0.1

Supplementary Information is available through the FigShare website at http://dx.doi.org/10.6084/m9.figshare.977967

Urbanization bias I. Is it a negligible problem for global temperature estimates?

Ronan Connolly1*, Michael Connolly1
1 Dublin, Ireland.
* Corresponding author. E-mail:
UHI_schematic

Several studies have claimed that the warming bias introduced to global temperature estimates by urbanization bias is negligible. On the basis of this claim, none of the groups calculating global temperature estimates (except for NASA Goddard Institute for Space Studies) explicitly correct for urbanization bias. However, in this article, by re-evaluating these studies individually, it was found that there was no justification for this.

There is considerable evidence that there has been global warming since the late 1970s. The urbanization bias problem is sometimes incorrectly framed as being a question of whether there has recently been global warming or not. However, the recent warming appears to have followed a period of global cooling from an earlier warm period which ended in the 1940s. So, resolving the urbanization bias problem is necessary to address issues such as how the recent warm period compared to the early 20th century warm period. If the earlier warm period was comparable to the recent warm period, then claims that recent global temperature trends are unprecedented or unusual will need to be re-evaluated.

R. Connolly, and M. Connolly (2014). Urbanization bias I. Is it a negligible problem for global temperature estimates?, Open Peer Rev. J., 28 (Clim. Sci.), ver. 0.2 (non peer reviewed draft). URL: http://oprj.net/articles/climate-science/28
First submitted on: January 8, 2014. This version submitted on: February 3, 2015

Latest version

Download article – Version 0.2 pdficon_large (Submitted: February 3, 2015)

Older versions

Download article – Version 0.1 pdficon_large (Submitted: February 3, 2014)

Supplementary Information is available through the FigShare website at http://dx.doi.org/10.6084/m9.figshare.1005090

Creative Commons Licence
This work is licensed under a Creative Commons Attribution-ShareAlike 4.0 International License.

Global temperature changes of the last millennium

Ronan Connolly1*, Michael Connolly1
1 Dublin, Ireland.
* Corresponding author. E-mail:
convergence

A review of the various global (or hemispheric) millennial temperature reconstructions was carried out. Unlike previous reviews, technical analyses presented via internet blogs were considered as well as the conventional peer-reviewed literature.

There was a remarkable consistency between all of the reconstructions in identifying three climatically distinct periods. These consisted of two relatively warm periods – the “Medieval Warm Period” (c. 800-1200 AD) and the “Current Warm Period” (c. 1900 AD on) – and a relatively cool period – the “Little Ice Age” (c. 1500-1850 AD). Disagreement seems to centre over how the two warm periods compare to each other, and exactly how cold, and continuous the cool period was.

However, many of the assumptions behind the reconstructions have still not been adequately justified. In addition, there are substantial inconsistencies in the data on which they are based, and between proxy-based and thermometer-based estimates.

R. Connolly, and M. Connolly (2014). Global temperature changes of the last millennium, Open Peer Rev. J., 16 (Clim. Sci.), ver. 1.0. URL: http://oprj.net/articles/climate-science/16
First submitted on: January 8, 2014. This version submitted on: October 11, 2014

Creative Commons Licence
This work is licensed under a Creative Commons Attribution-ShareAlike 4.0 International License.

Latest version

pdficon_large Download article – Version 1.0 (Submitted: October 11, 2014)

Supplementary Information is available through the FigShare website at http://dx.doi.org/10.6084/m9.figshare.977937

Older versions

pdficon_large Download article – Version 0.1 (Submitted: January 30, 2014)

Has poor station quality biased U.S. temperature trend estimates?

Ronan Connolly1*, Michael Connolly1
1 Dublin, Ireland.
* Corresponding author. E-mail:
surfacestations_ratings

Two independent surveys have found that about 70% of the thermometer stations in the U.S. Historical Climatology Network (USHCN) dataset are currently poorly or badly sited. Previous investigations into how this poor siting has affected estimates of U.S. temperature trends have led to apparently contradictory conclusions. However, in this study, these contradictions are resolved, and it is shown that poor station quality has introduced a noticeable warming bias into temperature trend estimates for the U.S.

For the unadjusted station records, this poor siting increased the mean temperature trends by about 32%. When time-of-observation adjustments were applied to the records, this increased temperature trends by about 39%, and so the relative fraction of the trends due to the siting bias decreased. However, the siting biases were still substantial, and increased trends by about 18%.

The step-change homogenization algorithm which had been developed to remove non-climatic biases such as siting biases was shown to be seriously problematic. Instead of correcting the poorly- and badly-sited station records to match the trends of the well-sited stations, it appears to have blended the temperature records of all stations to match the trends of the poorly-sited stations.

It seems likely that similar poor siting biases also exist in global thermometer datasets, and this has probably led to an overestimation of the amount of “global warming” since the 19th century.

R. Connolly, and M. Connolly (2014). Has poor station quality biased U.S. temperature trend estimates?, Open Peer Rev. J., 11 (Clim. Sci.), ver. 0.1 (non peer reviewed draft). URL: http://oprj.net/articles/climate-science/11
First submitted on: January 8, 2014. This version submitted on: January 8, 2014

Creative Commons Licence
This work is licensed under a Creative Commons Attribution-ShareAlike 4.0 International License.

pdficon_large Download article – Version 0.1

Supplementary Information is available through the FigShare website at http://dx.doi.org/10.6084/m9.figshare.1004025